
The science of the next half second
The physics, maths and human factors behind real-time coaching - from braking distance and grip to the Kalman filter, and where AI takes it next.
At 100mph a car covers about 45 metres every second. A driver who hesitates for a quarter of a second at the braking board is 11 metres past it before the pedal moves.
That is the core engineering problem we set out to solve at RaceLineApp.ai. Most track day technology is designed to describe what happened: it records the lap and presents the data afterwards. We wanted to build something that works in the half second before the driver needs to act. This article explains the science that makes that possible.
Braking scales with the square of speed
A moving car’s kinetic energy is proportional to the square of its speed, and the brakes have to dissipate all of it. Braking distance therefore grows with speed squared, not in proportion to it. Arrive 20% faster and you need roughly 44% more distance to scrub off the same speed.
This is why a fixed braking marker is only right for one entry speed. As a driver gets quicker through a session, the correct braking point moves back up the straight. RaceLineApp calculates each call live from the car’s actual speed, the car itself, the circuit geometry and the surface conditions the driver sets before the session: dry, damp or wet. Less grip means a longer stopping distance, and the call moves with it.
Where is only half of it. How the pedal goes down matters just as much. The quickest stops start with a rapid, firm initial hit that pitches weight onto the front tyres at the top of the zone, where there is the most speed to lose and, on a car with downforce, the most grip to use. The pressure then comes off progressively as the car slows. A driver who squeezes the pedal gently wastes the most valuable metres of the zone and runs out of road. That is why the call is “Hard on the brakes” rather than just “Brake”, and why the screen shows how much brake to use, not only when.
The grip budget
A tyre can only generate a finite amount of force, and that force is shared between braking, accelerating and cornering. Engineers often draw this as a friction circle: use all of it under braking and nothing is left for turning, and the reverse.
Quick drivers blend the two, releasing the brake progressively as steering lock goes on so the tyre stays near its limit throughout the corner. That is why our calls follow a deliberate sequence, and why the advanced coaching setting addresses the overlap between braking and turning rather than treating them as separate events.
Every car has its own limits
The numbers above describe a generic car that brakes and corners at 1.0g. Real cars don’t, and the differences between them are large.
Weight is less simple than it looks. In the idealised physics, mass cancels out: a heavier car needs more force to stop, but it also presses its tyres harder into the road. In practice, a tyre’s grip doesn’t rise as fast as the load on it, so each extra kilogram buys slightly less grip, and a heavier car puts far more heat into its brakes. Weight costs you, just not in a straight line.
Downforce changes the picture completely. Aerodynamic downforce grows with the square of speed, adding grip without adding mass. A car with real downforce can brake harder at the start of a braking zone, when it is fastest, than at the end. Its braking point sits later, and the pressure has to come off as the speed, and the downforce, bleed away.
Suspension setup decides how quickly the weight moves. Springs, dampers and geometry govern how fast the load transfers onto the front tyres under braking and onto the outside tyres in a corner, and how settled the car is when it gets there. Two cars with the same weight can behave very differently at the limit.
The brakes themselves matter too. Their size, their cooling and the pads and discs fitted decide how hard, and for how long, a car can keep stopping. And then there are the tyres, which deserve an article of their own.
That is why RaceLineApp coaches for the car you are driving. Each car’s reference is calibrated to that car, so a braking call for a Porsche GT4 is not the same as one for a hatchback on road tyres, and both are different from a car with a big rear wing.
The track isn’t flat
Circuits are drawn flat on a map, but they are three-dimensional. On a downhill braking zone, gravity acts along the slope against the brakes. On a 5% gradient that is around 0.05g, so the car needs more distance to stop. Uphill, gravity works with the brakes.
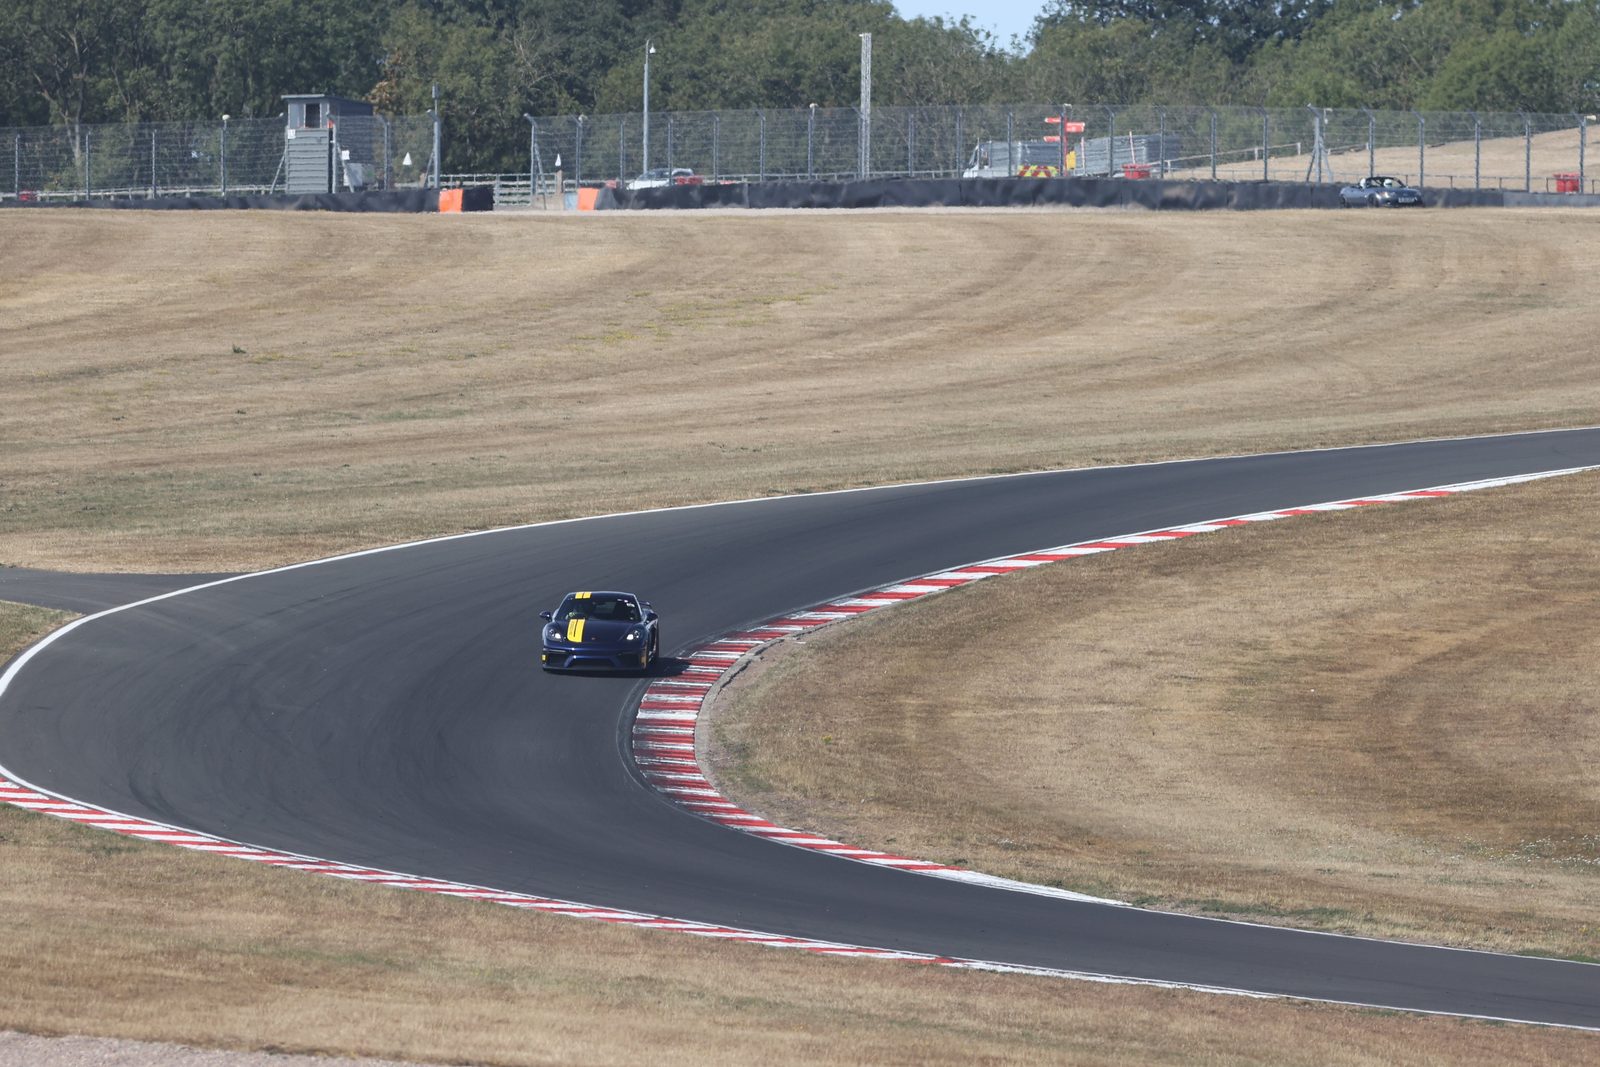
Craner Curves at Donington drops roughly 24 metres into the Old Hairpin, which is exactly where drivers commonly overcook their entry. Our own lap data shows it clearly.
Vertical curvature changes grip as well. A compression loads the suspension and presses the tyres into the road, increasing available grip. A crest does the opposite, unloading the car when the driver may need grip most. Brake or turn hard as the car goes light and the rear can step out with very little warning, which is why experienced drivers get the work done and the car settled before a crest like the Mountain at Cadwell Park. Camber has a similar effect laterally: a corner banked towards the inside helps hold the car, while an off-camber corner reduces the grip available. RaceLineApp is built to model each circuit in three dimensions, so the braking call reflects the gradient the car is on, not just the corner ahead, and calls are designed to land so the car is settled before it goes light.
Position: why we use an extended Kalman filter
A coaching call is only as good as its timing, and timing depends on position. Satellite positioning is accurate on average but noisy from one fix to the next. Inertial motion sensors are the opposite: they respond instantly and smoothly, but their errors accumulate over time. Neither is sufficient on its own.
The standard engineering answer is sensor fusion using a Kalman filter. Rudolf Kálmán published the method in 1960, and the extended form, which handles non-linear motion, was developed at NASA for the Apollo navigation computer. The same family of techniques is used in aircraft navigation and in cruise missiles such as the Tomahawk, which combine inertial guidance with satellite and terrain data.
The filter runs a continuous predict-and-correct loop. It first predicts the car’s next state from its current speed, heading and the forces acting on it. When a new position fix arrives from the GPS puck, 25 times a second, it compares that measurement with the prediction and updates the estimate:
If that line has you feeling like the maths meme, here’s the plain-English version. x̂− is the predicted state, z is the new measurement, and h(x̂−) is what the filter expected that measurement to be. The difference between the two is the innovation, and K, the Kalman gain, sets how much of that innovation to accept. The gain is recalculated at every step from the estimated uncertainty of each source. When the satellite signal is clean, the filter trusts it more. When it degrades, the filter leans on the motion model. The “extended” part linearises the equations around the current estimate, which is what allows the method to follow a car’s curved, non-linear path through a corner.
The result is a position estimate that is more accurate and more stable than either input alone, which is what lets a call land at the marker rather than near it.
Timing also has to allow for the call itself. At 100mph, a call that starts at the braking point has already arrived too late. So RaceLineApp times each call to where the car will be, not where it is, allowing for the time the audio takes to reach the driver’s ear. The rule is that a driver waiting for a brake call is never left with silence. If the ideal moment has passed, the call still comes, straight away and with urgency. Before each braking zone the screen also arms and counts down the distance to the brake point, so the call confirms something the driver is already expecting rather than arriving cold.
The system also needs to know when the car has left the line altogether. While it is off the line, RaceLineApp holds its calls. As soon as the car rejoins the line, the brake call comes straight away, with urgency if the braking point has already passed.
Human factors: why the coaching is audio-first
At speed, a driver’s visual attention is close to saturated: track position, kerbs, mirrors, flags and other cars all compete for it. Human-factors research, notably Christopher Wickens’ multiple resource theory, holds that visual and auditory information draw on largely separate pools of attention, so information delivered by sound adds less load to an already busy visual system. The size of that benefit depends on the task, and some studies find little difference, so we treat it as a design principle rather than a guarantee. Simple reaction times to sound are also typically a few tens of milliseconds quicker than to light.
So the primary interface is the voice. Calls are short and in plain English, “Hard on the brakes”, “Commit”, “Carry deep speed”, and are delivered through a Bluetooth earpiece or helmet comms.
Hearing has its limits too. Under acute stress, people can stop registering sound altogether, a well-documented effect known as auditory exclusion. The voice and the screen therefore carry the same message, so if speech is filtered out, the answer is still in the corner of the driver’s eye.
The screen is designed for peripheral vision, not direct viewing. Peripheral vision is poor at resolving detail, and colour discrimination falls away towards the edge of the visual field, but it remains highly sensitive to changes in brightness and to large areas of colour. The display therefore avoids maps and dense readouts. At speed it reduces to large, saturated, high-contrast colour blocks that communicate magnitude, not detail: red for brake, amber for turn, green for power. Colour is never the only signal, though. Red-green discrimination is the first to fade towards the edge of vision, and around one in twelve men have some degree of red-green colour deficiency, so position and size carry the same message: brake is always on the left, power on the right, and each bar grows with how much is needed. Newer drivers get more on screen; as a driver progresses, the visual steps back and the voice does more of the work. The display is designed so the driver never needs to look at it directly.
The coaching model
Physics defines what the car can do; coaching defines how a driver gets there. The entire RaceLineApp coaching engine, cues included, is validated by our Coaching Director Mark White, a Grade A ARDS instructor and 2025 Armed Forces Race Challenge Champion. The language in the earpiece is the language an experienced instructor uses from the passenger seat.
The AI race engineer
In Formula 1, the race engineer’s value is context. They know the car, the tyres, the conditions and, above all, the driver. RaceLineApp is designed around the same principle, with AI providing that context at scale.
The system is built to learn each driver’s habits, such as where they brake early, where they turn in tight, and how consistently they hit their marks, and to adapt its coaching to that driver rather than to an average one. Drivers will be able to interrogate their sessions in plain English between runs, asking why a corner isn’t working and getting a specific answer.
Over time, each driver develops a personal cue vocabulary. As confidence grows, the calls compress from full instructions into shorthand that is specific to that driver, in the same way a rally co-driver’s pace notes evolve over a season. Two drivers in the same corner can receive different calls.
The model is also designed to understand the car: how weight transfers under braking, how balance shifts through a corner, and how a specific car responds to inputs.
Most importantly, it is designed to improve with use. Every lap driven, across every driver, circuit, car and condition, adds to the data the models learn from. A driver’s thousandth lap at Silverstone benefits from every lap other drivers have completed there before. In engineering terms, the system’s accuracy scales with the size of the fleet.
Beyond the track day
The underlying problem is the same for any driver trying to go faster: the right input, at the right moment, with no time to think about it. That applies to track day drivers, and equally to club racers, sprint and hillclimb competitors, and drivers in their first competitive season. We see RaceLineApp becoming a standard part of the kit bag across motorsport.
What it isn’t
RaceLineApp is not a lap timer. It records laps and maps every corner for review, but its purpose is the half second between seeing the board and pressing the pedal.
We’re already testing RaceLineApp on track. In spring 2027 we test it at scale, with 50 drivers in Porsche GT4s at Silverstone GP. If you would like to be one of them, you can apply for the beta.